Bozeman Real Estate
Investment Report
A review of investment real estate conditions in Bozeman and southwest Montana for 2026, including market conditions, rent prices, residential outlook, and the continued global appetite for real estate as an investment class.
The post-pandemic real estate normalization that began in 2022 has largely played out. National markets spent 2023 and 2024 adjusting to elevated interest rates, with transaction volume subdued and annual appreciation modest. By 2026, a degree of stability has returned. Rates have declined from their 2023 peaks but remain elevated relative to the historic lows of 2020-2021, and the broader economic environment continues to favor tangible, income-producing assets.
In Bozeman, the story has shifted from rapid appreciation to steady fundamentals. Price growth has moderated from the double-digit gains of 2021-2022, with the single-family median now at $925,000 following three consecutive years of 1-2% annual gains. What has not changed is the underlying demand: Bozeman continues to draw buyers from larger metros, the rental market remains supply-constrained, and the market offers investors more inventory and more negotiating room than at any point since 2019.
Stability and long-term conviction
Investors working with Delger Real Estate have shifted focus from rapid appreciation to durable fundamentals. Bozeman’s housing shortage has not resolved, quality rental properties continue to command strong rents, and Gallatin County remains one of the fastest-growing counties in the western United States. Investors with a long-term horizon view the current, more measured market as a cleaner entry point than the frenzied conditions of 2021-2022.
More room to negotiate
The biggest shift from 2022 to 2026 is the return of negotiating leverage for buyers. Average days on market for single-family homes extended to 94 days as of April 2026, sellers are more willing to negotiate on price and terms, and bidding wars are no longer the norm. Investors entering the market today can conduct proper due diligence and negotiate on financing contingencies in ways that were nearly impossible just a few years ago.
Mortgage rates increased dramatically in 2022 and peaked in late 2023, making it significantly more difficult to find investment properties that generate positive cash flow from day one. Rates have since moderated, but remain elevated relative to the pre-2022 environment. Investors who have navigated this period successfully are those who underwrote their deals conservatively, maintained adequate reserves, and focused on properties with strong intrinsic rental demand independent of rate conditions. The long-term investment case for Bozeman has not changed.
Real estate is the most searched investment type globally
When many people think about investing, they think of the stock market. But a global investment study published by Forex Suggest measured which investments received the most Google searches worldwide, finding that real estate consistently outpaces every other asset class in investor interest and curiosity.
Real estate ranked as the most searched investment type globally, with over 1.16 million searches in a 12-month period. It held the number one position in 11 different countries, including the United States, reflecting a sustained preference for tangible, income-producing assets over equities and alternatives.
| Rank | Investment type | Search term | Search volume |
| 1 | Real Estate | invest in real estate | 1,164,000 |
| 2 | Stocks | invest in stocks | 867,000 |
| 3 | Gold | invest in gold | 850,500 |
| 4 | Cryptocurrency | invest in cryptocurrency | 814,700 |
| 5 | Mutual Funds | invest in mutual funds | 744,500 |
| 6 | Property | invest in property | 717,500 |
| 7 | Crypto | invest in crypto | 560,900 |
| 8 | Commodities | invest in commodities | 443,200 |
| 9 | Bonds | invest in bonds | 377,100 |
| 10 | ETFs | invest in ETFs | 317,600 |
Types of real estate investments
There are several types of real estate investment that investors should be familiar with. Each comes with unique advantages and disadvantages that should be evaluated in the context of your goals, risk tolerance, and available capital.
| 01 | Residential real estate |
| 02 | Commercial real estate |
| 03 | Raw land and new construction |
| 04 | Real Estate Investment Trusts (REITs) |
| 05 | Crowdfunding platforms |
Bozeman residential real estate investment outlook
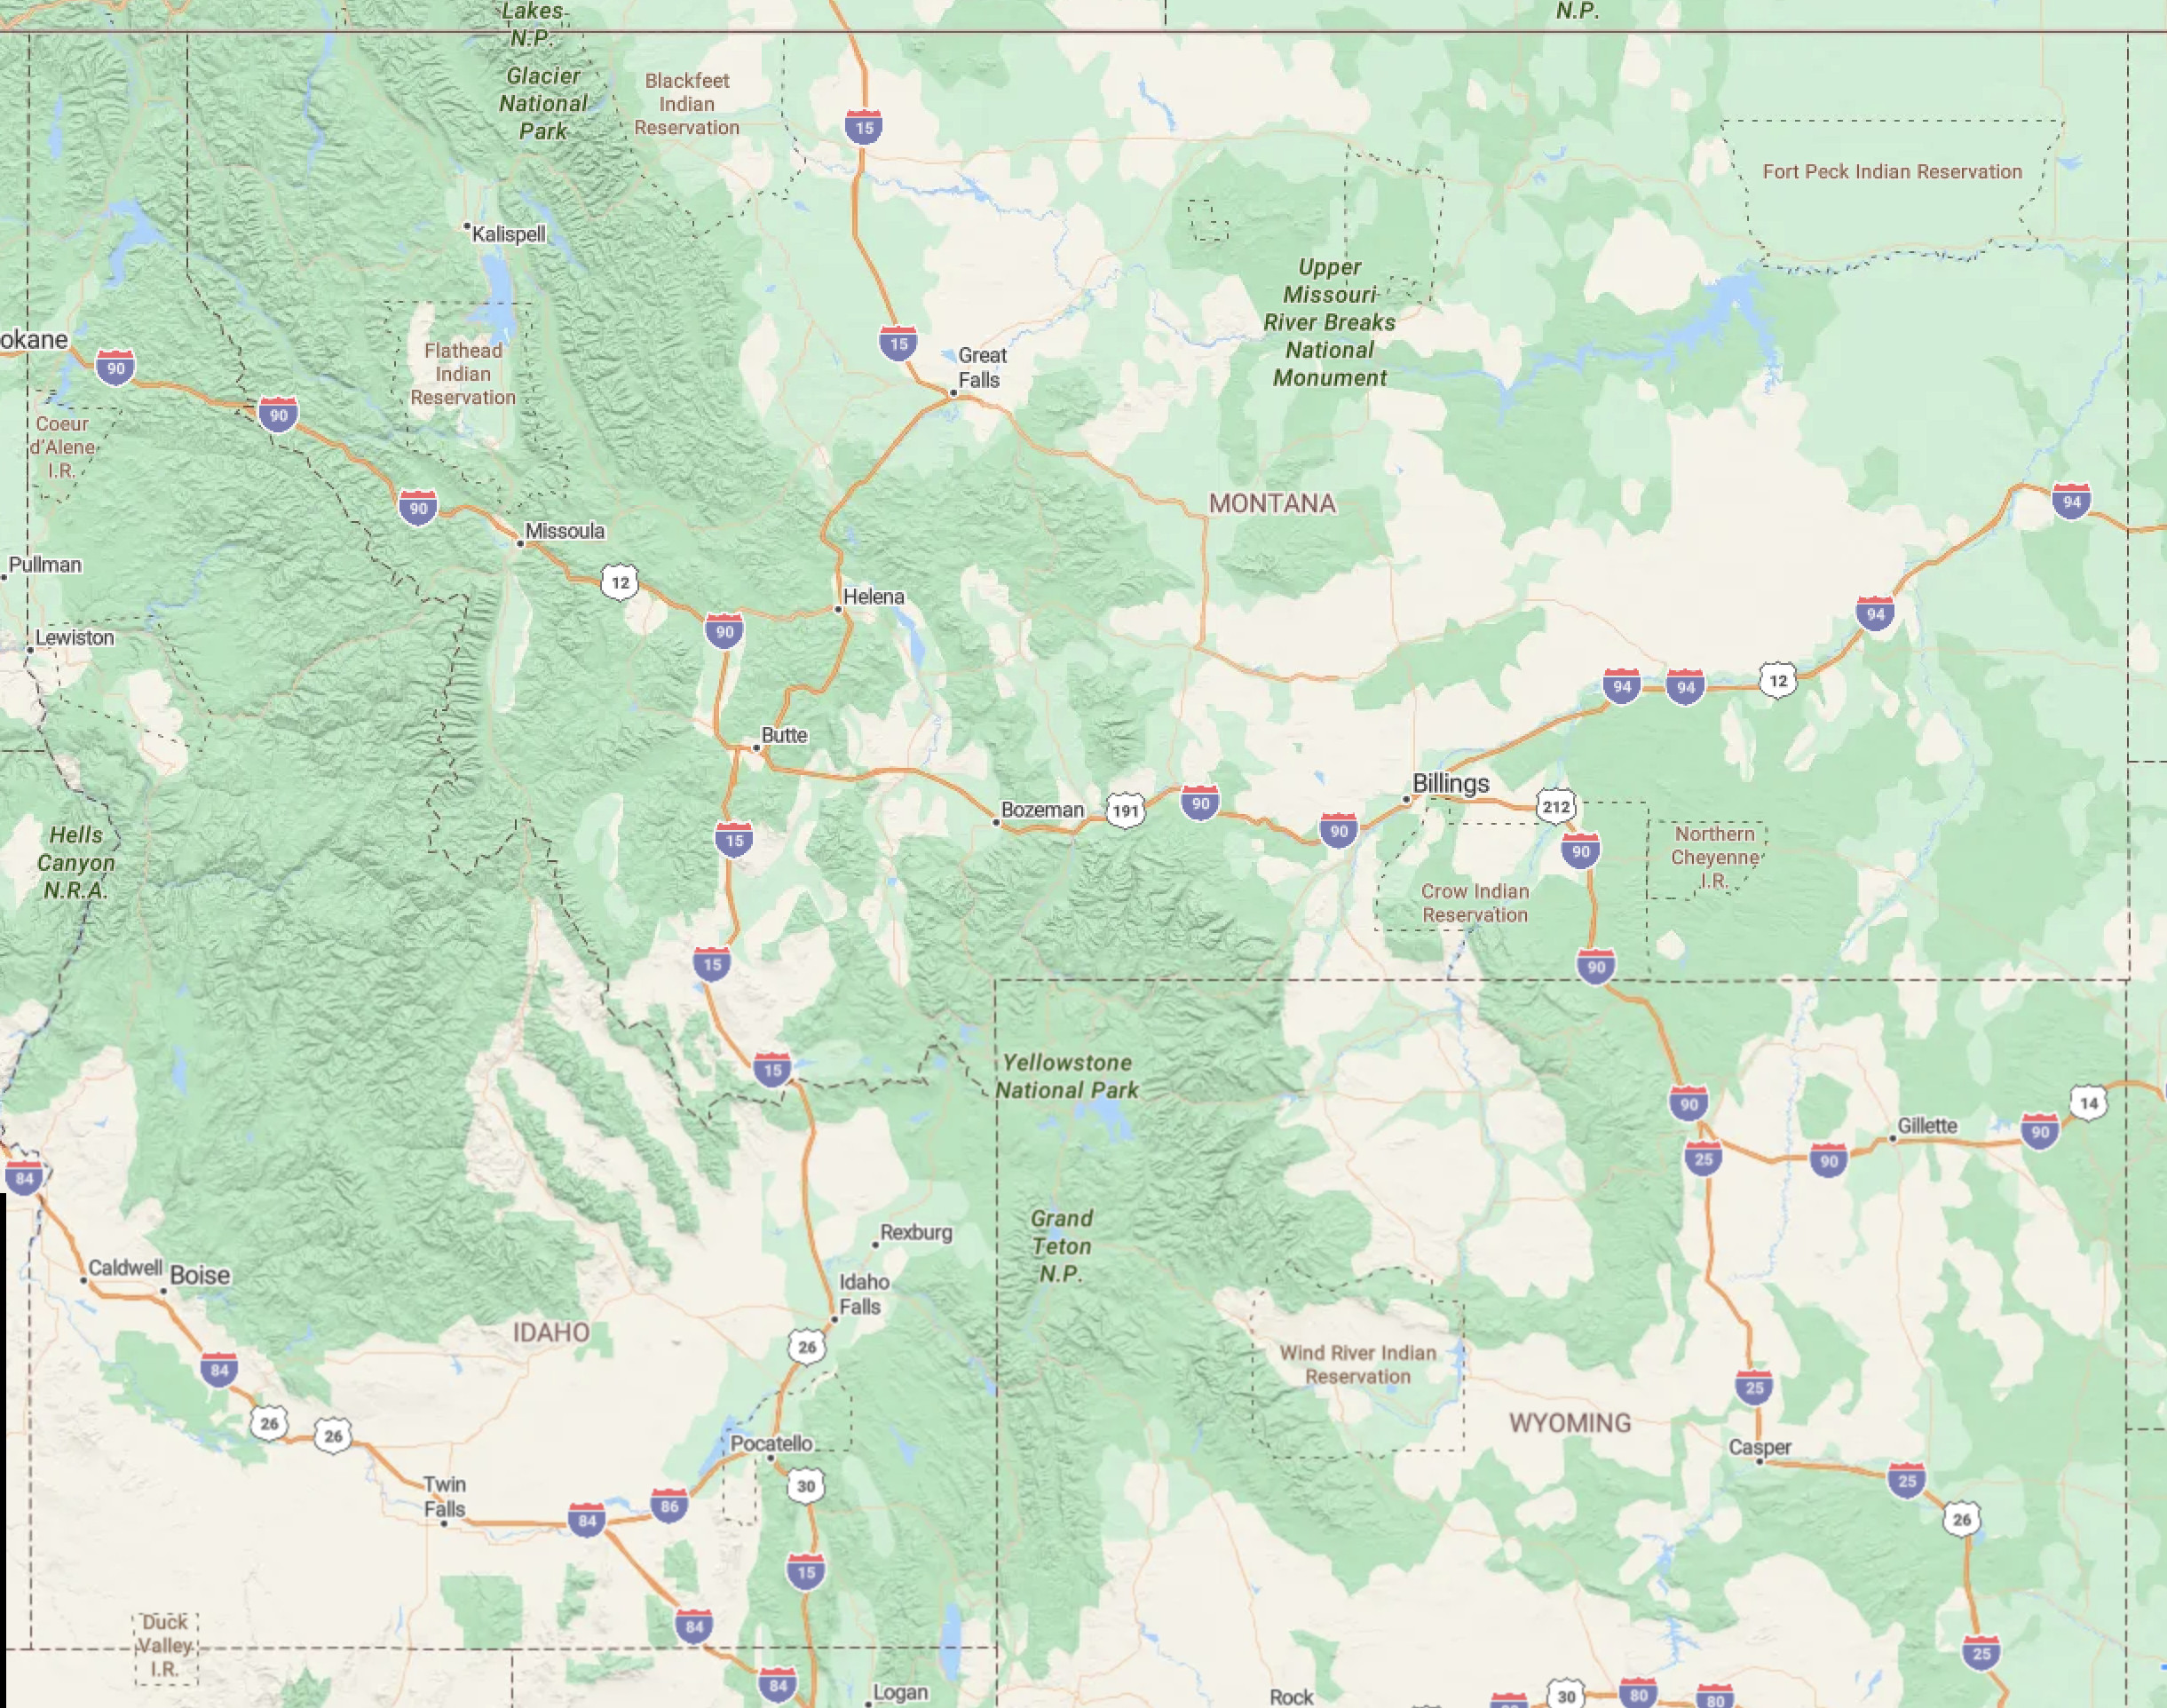
Delger Real Estate is primarily focused on residential real estate. Quality of life plays a significant role in where people choose to live, and Bozeman continues to attract buyers from across the country. Current market data, updated monthly from the Southwest Montana MLS, is available at the links below.
The median single-family sale price reached $925,000 in 2025, up from $885,000 in 2022 and $409,000 in 2017. After the extraordinary 18% single-year gain recorded in 2022, annual appreciation has settled into a 1-2% range through 2023, 2024, and 2025. As of April 2026, 241 single-family homes are active on the market with an average days-on-market of 94 days, reflecting a more balanced environment with meaningful inventory for buyers to evaluate. View live single-family market data and condominium market data for current figures.
After gaining 18% in 2022, appreciation moderated to 1-2% annually through 2023-2025. The long-term appreciation story remains compelling: the median price has risen from $409,000 in 2017 to $925,000 in 2025, a gain of over 126% in eight years. Source: BSCMLS.
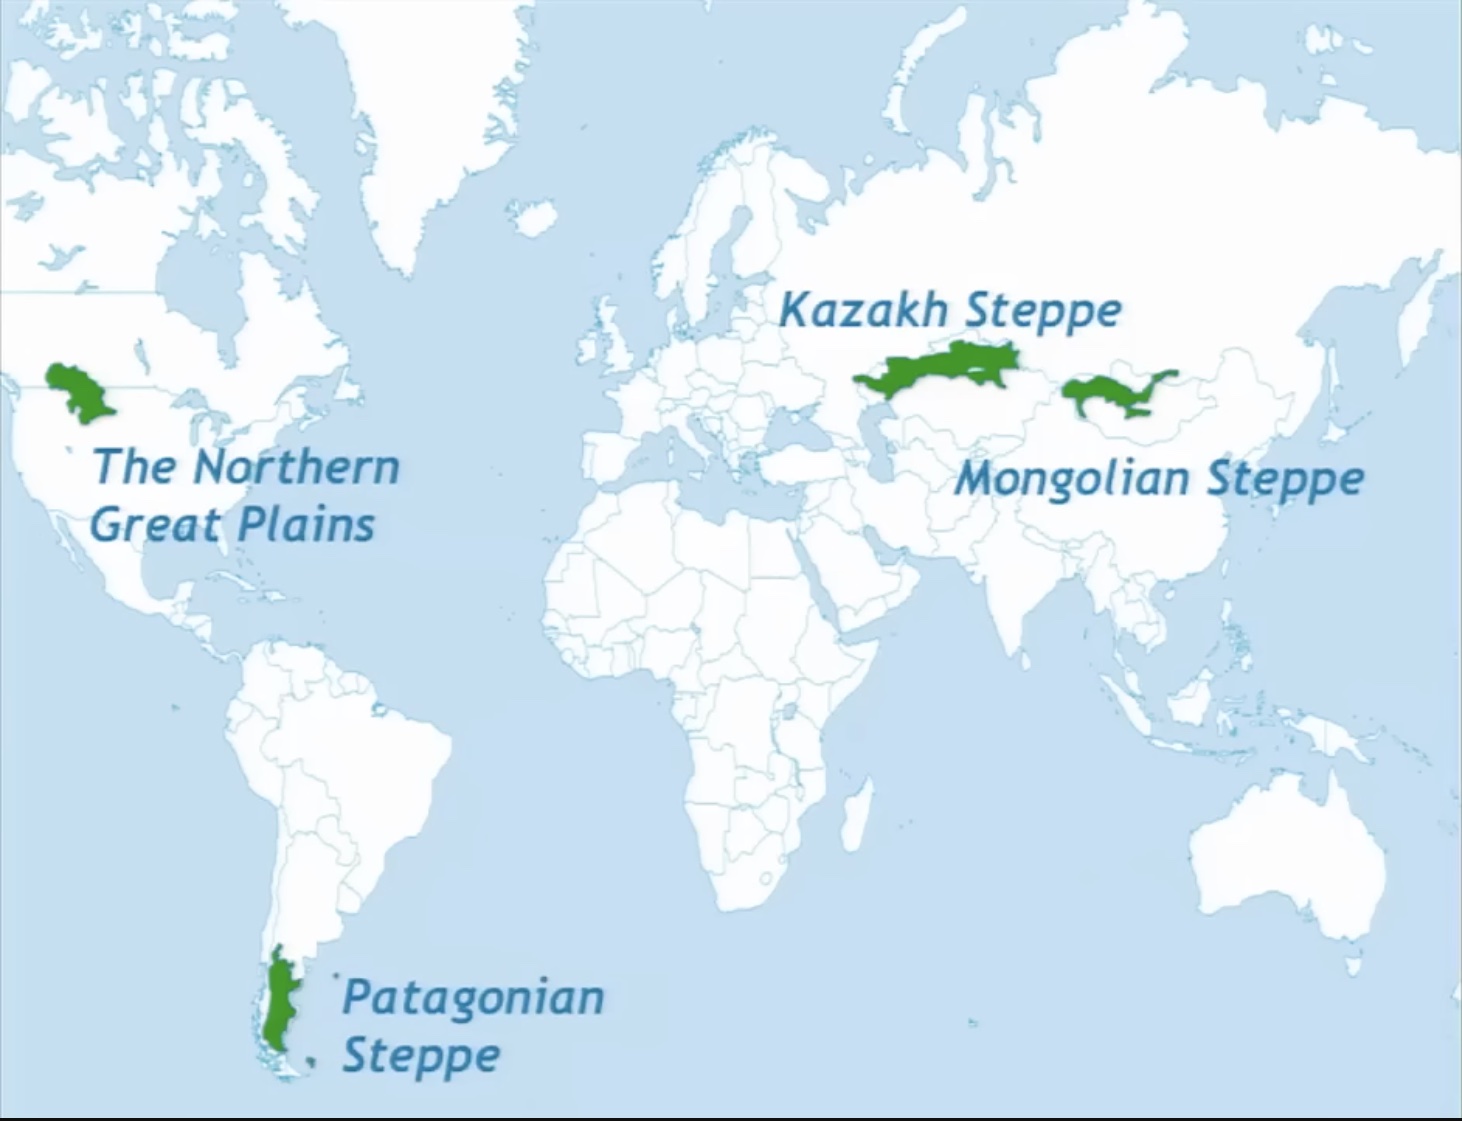
Driven by sustained in-migration and a chronic housing shortage, Bozeman has delivered strong long-term appreciation across market cycles. Gallatin County remains one of the fastest-growing counties in the western United States, continuing to support demand for both owner-occupied and rental housing.
43% of Bozeman households are owner-occupied and 57% are renter-occupied. Statewide, 68% of households are owner-occupied, making Bozeman’s renter-heavy composition unusual and persistently advantageous for rental property investors.
Bozeman rent prices (2025)
Rent prices in Bozeman have remained elevated across all unit types and have continued to rise modestly from 2022 levels, supported by ongoing demand and limited rental inventory throughout the Gallatin Valley.
| 1-bedroom | ~$1,850 | |
| 2-bedroom | ~$2,250 | |
| 3-bedroom | ~$2,800 | |
| 4-bedroom | ~$3,800 |
Interested in investment real estate in Bozeman?
Contact Delger Real Estate to learn more
about opportunities in southwest Montana.