CONTACT FORM
Quisque tincidunt ornare sapien, at commodo ante tristique non. Integer id tellus nisl. Donec eget nunc eget odio malesuada egestas.
SEND
Location & Address
Login form
Sorry, User can NOT register!

American Prairie Reserve

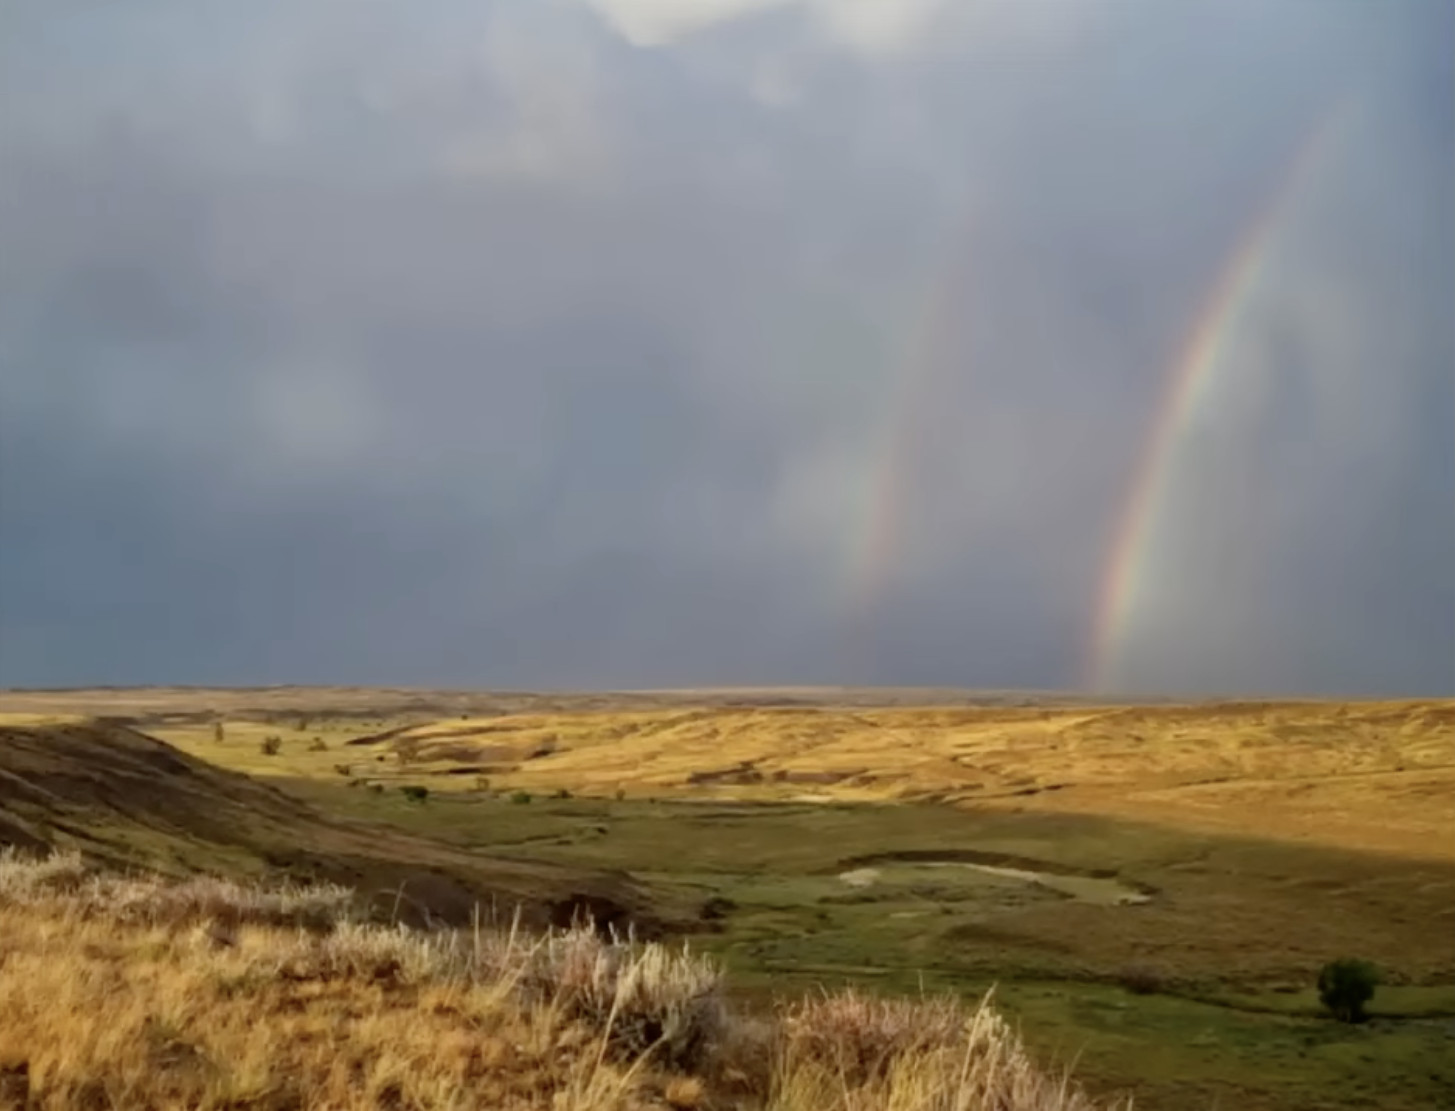
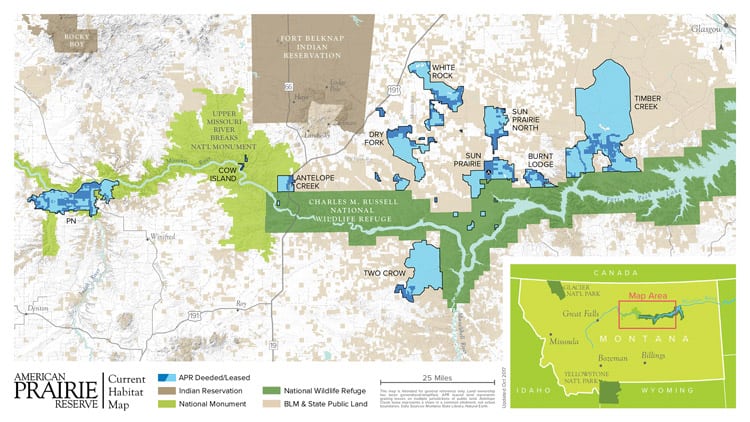
The American Prairie Reserve is currently 3.2 million acres in size, and it is aiming to reach 10 million acres. It is the largest wildlife reserve in the lower 48 states. The American Prairie Reserve is a private, non-profit organization that is working to restore and protect the prairie ecosystem in north-central Montana.

The reserve was founded in 2004 by The Nature Conservancy and the American Prairie Foundation. The reserve is located in the Judith Basin, which is a region of rolling hills and grasslands that was once home to millions of bison. The reserve is working to restore the prairie ecosystem by removing invasive species, restoring native grasses, and reintroducing bison and other native wildlife.

One of the primary goals of the American Prairie Reserve is to restore the biodiversity that once defined the Montana plains. The reserve’s management employs a multi-faceted approach that includes habitat restoration, reintroduction of native species, and the establishment of conservation partnerships with neighboring communities. Efforts are underway to bring back iconic species such as bison, pronghorn, elk, and even black-footed ferrets, all of which play vital roles in maintaining the delicate balance of the ecosystem.

As of January 2023, there are 774 bison on the American Prairie Reserve. The reserve’s bison herd is the largest free-roaming herd of bison in the United States outside of Yellowstone National Park. The American Prairie Reserve’s goal is to establish a heard of 5,000 bison.

The American Prairie Reserve is a working landscape, and the bison herd is managed for both conservation and economic purposes. The bison provide a source of income for the reserve through hunting and bison products. The reserve also offers educational programs and opportunities for visitors to experience the prairie ecosystem.

The American Prairie Reserve is a unique and important project that is helping to restore the prairie ecosystem and conserve bison. The reserve is a model for other conservation projects around the world.

Montana Quick Facts

Here are some quick facts about Montana you may find interesting.

  • Nickname: The Treasure State
  • Statehood: 1889; 41st state
  • Population (2020): 1,079,619
  • Land area: 147,046 square miles
  • Highest point: Granite Peak, 12,799 feet (3,899 m)
  • Lowest point: Kootenai River, 1,807 feet (551 m)
  • Major rivers: Missouri River, Yellowstone River, Milk River
  • Major lakes: Flathead Lake, Yellowstone Lake, Fort Peck Lake

Montana is the number one state in the following categories:

Percentage of land that is designated as wilderness

Montana has more wilderness areas than any other state in the lower 48. There are over 17 million acres of wilderness in Montana. Approximately 13.4% of Montana’s land is designated as wilderness. This includes 24 designated wilderness areas covering 3.4 million acres, as well as 12 million acres of roadless areas that are managed under wilderness guidelines.

The Wilderness Act of 1964 established the National Wilderness Preservation System to protect areas of land that are “untrammeled by man, where man himself is a visitor who does not remain.” Wilderness areas are managed to preserve their natural conditions and to provide opportunities for solitude and recreation.

Percentage of land that is forested

Montana has more land that is forested than any other state in the lower 48. Approximately 22.5 million acres, or 15.8% of Montana’s land area, is forested. Of this, 85% is federally owned. Montana’s forests are home to a wide variety of tree species, including ponderosa pine, lodgepole pine, Douglas-fir, spruce, and fir.

Percentage of land in public ownership

Montana has more land that is publicly owned than any other state in the lower 48. According to the Congressional Research Service, 62.5% of Montana’s land is publicly owned.

National Parks

Montana has four national parks: Glacier National Park, Yellowstone National Park, Little Bighorn Battlefield National Monument, and Theodore Roosevelt National Park.

National Forests

Montana has 17 national forests, which cover over 20 million acres.

Number of Elk

Montana has the largest elk population in the lower 48 states, with an estimated 120,000-150,000 elk. The next highest elk populations are in Wyoming (70,000-90,000 elk) and Colorado (60,000-80,000 elk).

Number of Mule Deer

According to the Montana Department of Fish, Wildlife & Parks (FWP), there are an estimated 250,000 – 335,000 mule deer in Montana. This is the largest population of mule deer in the lower 48 states.

Number of Bighorn Sheep

There are approximately 6,000 bighorn sheep in Montana. This number has been increasing in recent years due to conservation efforts. Montana has the largest bighorn sheep population in the lower 48 states. The next highest populations are in Wyoming (2,000-3,000 sheep) and Idaho (1,000-2,000 sheep).

Number of grizzly bears

Montana has the largest grizzly bear population in the lower 48 states, with an estimated 1,500 bears. The other states with grizzly bear populations are Wyoming, Idaho, and Washington. Wyoming has an estimated 700 bears, Idaho has an estimated 1,000 bears, and Washington has an estimated 200 bears.

Number of Wolves

According to the Montana Fish, Wildlife & Parks (FWP), there are an estimated 1,144 wolves in Montana as of January 2023. This is the highest number of wolves in the state since the 1990s.

The wolf population in Montana is much higher than the wolf populations in other states. Wyoming has an estimated 118 wolves, Idaho has an estimated 1,050 wolves, and Washington has an estimated 162 wolves.

Number of Antelope

According to the Montana Fish, Wildlife & Parks (FWP), there are an estimated 155,000 antelope in Montana as of January 2023. This is the highest number of antelope in the state since the 1970s.

Montana has the largest antelope population in the United States. Wyoming has an estimated 120,000 antelope, and South Dakota has an estimated 60,000 antelope.

Number of Bison

Montana has the largest protected herd of wild bison in the United States. The National Bison Range is located in the Flathead Valley in northwestern Montana and is home to over 5,000 bison. As of January 2023, there are 774 bison on the American Prairie Reserve. The American Prairie Reserve is a 3.2-million-acre prairie reserve(aiming to reach 10 million acres) located in north-central Montana. The reserve is dedicated to restoring and protecting the prairie ecosystem, and bison are a keystone species in the prairie ecosystem. The reserve’s bison herd is the largest free-roaming herd of bison in the United States outside of Yellowstone National Park. The American Prairie Reserve’s goal is to establish a heard of 5,000 bison.

The Real Estate Cycle

The real estate industry is known for being cyclical, with periods of boom and bust that can have a profound impact on the economy. One such cycle that has been observed and studied extensively is the 18.6-year Real Estate Cycle, also known as the Land Cycle or Property Cycel. This cycle is based on the observation that major peaks and troughs in the real estate market tend to occur roughly every 18 to 19 years. Understanding this cycle is crucial for investors, developers, and policymakers alike, as it can provide valuable insights into the direction of the market and help inform investment decisions.

Why is there a real estate cycle, and why does it repeat?

There are several factors that contribute to the real estate cycle, including economic, demographic, and policy-related factors. Economic factors, such as interest rates, inflation, and employment levels, can have a significant impact on the demand for housing and the overall health of the real estate market. Demographic factors, such as population growth, migration patterns, and changes in household composition, can also influence the demand for housing and the types of properties that are in demand. Finally, policy-related factors, such as zoning regulations, tax policies, and government incentives, can affect the supply and demand of housing and the overall health of the real estate market.

The real estate cycle is thought to repeat because of the interplay between supply and demand. During periods of economic growth and demographic expansion, demand for housing tends to increase, leading to a rise in prices and an increase in construction activity. However, as supply catches up to demand, prices begin to level off, and construction activity slows down. This eventually leads to an oversupply of housing, which, in turn, leads to a decline in prices and a decrease in construction activity. As prices bottom out and the oversupply is absorbed, the cycle starts anew with a period of economic growth and demographic expansion.

Stages of the Real Estate Cycle

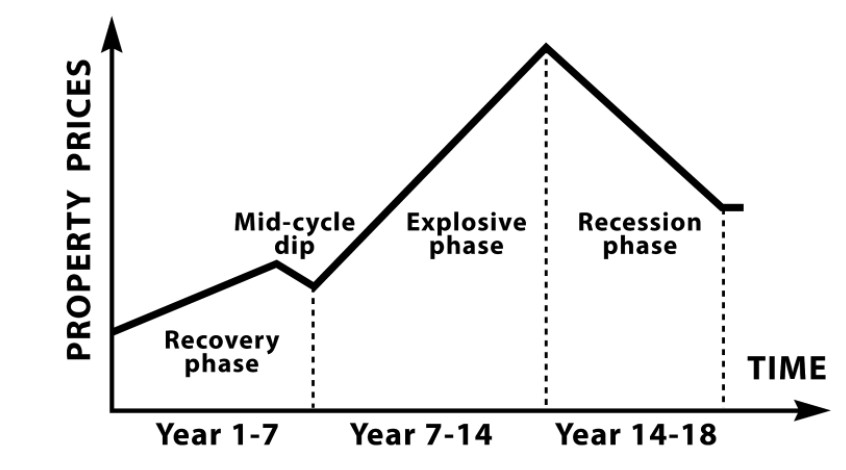
Real Estate Cycle
The real estate cycle is typically divided into stages or phases: recovery, expansion, hyper-supply, and recession. Understanding these stages is crucial for investors and developers, as it can help inform investment decisions and risk management strategies.

1. Recovery Phase: This stage occurs immediately after a market downturn and is characterized by low prices and low levels of construction activity. Property prices have fallen enough to tempt investors to begin buying again, attracted by the high yields that are available from low home prices while rents remains healthy(rents remain strong because people always need a place to live). During this stage, investors and developers may begin to see opportunities to acquire properties at discounted prices, with the expectation of future price appreciation.

2. Expansion Phase: As the market recovers, demand for housing begins to increase, leading to rising prices and an increase in construction activity. During this stage, developers may begin to invest in new construction projects, with the expectation of future profits. Large companies and pension funds start buying up distressed portfolios. The prime assets will always be the most attractive, so this early growth tends to begin in the most popular real estate markets and expand from there.

3. Hyper-supply Phase: At some point, the increase in construction activity leads to an oversupply of housing, which can cause prices to level off or decline. During this stage, developers may face increased competition and a decrease in profitability, while investors may begin to look for opportunities to exit their positions. As the early movers take their profits there may be a slight mid-cycle dip.

4. Recession Phase: Eventually, the oversupply is absorbed, and the market begins to stabilize. However, if economic conditions deteriorate, it can lead to a recession, which can cause prices to decline sharply and lead to a decrease in construction activity. During this stage, investors and developers may face significant losses, and those who are over-leveraged may be forced to sell at a loss. Economist and author Fred Harrison used the term “winner’s curse” in his book “Boom Bust” to describe buyers that “won” by placing the highest bid for a property with multiple offers during this phase because the next recession isn’t far away, and it won’t be long before the asset they just purchased will be worth markedly less.

Previous real estate cycles in the United States

The United States has experienced several real estate cycles throughout its history, with some of the most notable cycles occurring in the 1920s, 1970s, and 2000s.

1. The 1920s: The 1920s saw a period of economic growth and demographic expansion, with the rise of the automobile and the growth of the middle class leading to an increase in demand for housing. This led to a period of expansion in the real estate market, with construction activity increasing and prices rising. However, this period of growth was not sustainable, and the market eventually experienced a major downturn in the late 1920s, which was exacerbated by the stock market crash of 1929. This led to a period of hyper-supply, with an oversupply of housing and a decrease in construction activity. The real estate market did not fully recover until after World War II.

2. The 1970s: The 1970s were marked by significant economic and demographic changes, including the oil crisis, inflation, and the rise of the baby boomer generation. These factors had a major impact on the real estate market, leading to a period of expansion in the early 1970s, followed by a period of hyper-supply in the mid to late 1970s. During this period, interest rates rose sharply, which led to a decline in demand for housing and a decrease in construction activity. The market did not fully recover until the early 1980s.

3. The 2000s: The 2000s saw a period of economic growth and demographic expansion, with the rise of the internet and the growth of the service sector leading to an increase in demand for housing. This led to a period of expansion in the early to mid-2000s, with construction activity increasing and prices rising rapidly. However, this period of growth was not sustainable, and the market eventually experienced a major downturn in the late 2000s, which was triggered by the subprime mortgage crisis. This led to a period of hyper-supply, with an oversupply of housing and a decrease in construction activity. The real estate market did not fully recover until several years later.

4. The real estate crash that occurred from 2006 to 2012, commonly referred to as the Great Recession, was one of the most significant downturns in the history of the U.S. real estate market. The crisis was triggered by a combination of factors, including loose lending standards, a housing bubble, and the proliferation of complex financial instruments that were poorly understood by investors and regulators alike.

Leading up to the crisis, housing prices had risen rapidly throughout the early 2000s, fueled by low interest rates, lax lending standards, and a speculative frenzy among investors. Many homeowners took on mortgages they could not afford, relying on the assumption that housing prices would continue to rise indefinitely. However, in 2006, the housing market began to cool off, and prices began to decline. This led to a wave of defaults and foreclosures, as homeowners found themselves unable to keep up with their mortgage payments.

At the same time, a variety of complex financial instruments had emerged that were tied to the value of housing, including mortgage-backed securities and collateralized debt obligations. These instruments were sold to investors around the world, who assumed that the underlying mortgages were sound and that the value of the securities would continue to rise. However, as the housing market began to collapse, the value of these securities plummeted, causing widespread losses and a crisis of confidence in the financial system.

The fallout from the Great Recession was severe, with millions of Americans losing their homes, and the U.S. economy entering a deep recession that lasted for several years. The crisis also had a significant impact on the real estate market, with housing prices falling by as much as 30% or more in some areas, and construction activity grinding to a halt. It took several years for the market to recover, with the government implementing a variety of policies and stimulus measures to help stabilize the economy and support the housing market.

The Great Recession serves as a stark reminder of the dangers of speculative bubbles and the importance of responsible lending practices. While the real estate market has since recovered, the scars of the crisis continue to be felt by many Americans, and the lessons learned from the experience will undoubtedly shape the way we think about real estate investing and financial regulation for many years to come.

In each of these cycles, home prices experienced significant changes. For example, during the 1920s cycle, home prices increased by roughly 60% between 1920 and 1929, before declining by roughly 30% between 1929 and 1933. Similarly, during the 2000s cycle, home prices increased by roughly 90% between 2000 and 2006, before declining by roughly 30% between 2006 and 2012.

Bozeman Real Estate Cycle

Bozeman, Montana, like many other regions, experiences a real estate cycle characterized by periods of growth and decline. Bozeman has experienced steady population growth in recent years, leading to increased demand for housing and a rise in real estate prices. The Bozeman area is known for its natural beauty, outdoor recreational opportunities, and a vibrant economy anchored by Montana State University.

The most recent Bozeman Real Estate Cycle began around 2010, following the Great Recession, with prices gradually recovering and then surging in the mid-2010s. By 2018, the market had become extremely competitive, with many buyers struggling to find affordable housing. However, by 2020, the market had begun to cool off, with prices stabilizing and demand decreasing somewhat.

Conclusion

The 18.6-year Real Estate Cycle, also known as the Land Cycle or Property Cycle, is a well-documented phenomenon that has been observed throughout history. While the causes of the cycle are complex and multifaceted, the interplay between supply and demand is a key driver. By understanding the stages of the cycle and the factors that contribute to it, investors, developers, and policymakers can make informed decisions and better manage risk. While past performance is not indicative of future results, studying the previous cycles can provide valuable insights into the direction of the real estate market and help inform investment decisions.

State Population Change in 2022

In the United States, population migration trends have undergone significant changes in recent years, with many people moving from one state to another.

One of the most significant factors driving population migration in the United States is taxes. Americans moved from high-tax states to low-tax states in 2022 according to data from U.S. Census Bureau, U-Haul, and United Van Lines.

The search for economic opportunities also contributed to population migration. Many people move from states with high unemployment rates to states with better job prospects. For example, the recent economic boom in Texas has led to an influx of people from other states, seeking employment opportunities in the state.

Another factor driving population migration is the desire for a better quality of life. Many people move to states with better weather, lower crime rates, and better access to education and healthcare. Montana and Idaho are known for their stunning natural beauty and offer a high quality of life along with a low cost of living. The states have a relatively low population density, which makes them attractive to people who prefer a more laid-back lifestyle. Many people move to these states to enjoy outdoor recreational activities such as hiking, skiing, and fishing.

The COVID-19 pandemic has also had an impact on population migration trends in the United States. The pandemic has led to an increase in remote work, allowing people to work from anywhere. As a result, many people have moved from expensive cities like New York and San Francisco to more affordable locations with a lower cost of living.

State Population Change 2022

States with the largest decreases in population were:

New York -0.9%
Illinois -0.8%
Louisiana -0.8%
West Virginia -0.6%
Hawaii -0.5%
Oregon -0.4%
California -0.3%
Pennsylvania -0.3%
Mississippi -0.3%
Rhode Island -0.3%


States with the largest increases in population were:

Florida +1.9%
Idaho +1.8%
South Carolina +1.7%
Texas +1.6%
Montana +1.5%
South Dakota +1.5%
Delaware +1.4%
Arizona +1.3%
North Carolina +1.3%
Utah +1.2%

Real Estate Market Information

Real Estate is the largest asset class in the world. The Global Real Estate market is estimated to be $217 trillion. To compare that to some other asset classes consider that the global equity market capitalization is valued at $70.1 trillion. The global bond market is valued at $92.2 trillion. Global real estate is a more valuable asset class than all the stocks, shares, and bond markets combined.

The residential real estate market in the United States is valued at $33.6 trillion. To place that in perspective, that number is equal to the combined annual GDP of the U.S. and China, the world’s two largest economies.

There is 3,531,837 square miles of land in the United States. There are approximately 140 million housing units in the United States. The number of homes sold each year in the United States is approximately 6 million. The median price for homes sold in the U.S. in Q1 2023 is approximately $330,000. Homeownership stands at 68 percent, the highest rate since 2008.

There are 2 million real estate agents in the United State with active licensees. 1.4 million of those agents(~70%) are members of the National Association of Realtors. The U.S. has approximately 80,000 real estate brokerages.

Big Sky Country MLS Information

Montana is the fourth largest state in the United States, with 56 counties spread across an area of 147,040 square miles. Big Sky Country MLS(BSCMLS) primarily covers Gallatin County, Park County, and Madison County. Silver Bow County was recently added to the counties that are served by BSCMLS.

Gallatin County, Montana is approximately 2,605 square miles (6,750 square kilometers). According to the United States Census Bureau, as of the most recent data available in 2020, the estimated population of Gallatin County, Montana is approximately 116,896 with 55,919 housing units.

Park County, Montana is approximately 2,791 square miles (7,227 square kilometers). According to the United States Census Bureau, as of the most recent data available in 2020, the estimated population of Park County, Montana is approximately 16,668 with 9,751 housing units.

Madison County, Montana is approximately 3,891 square miles (10,062 square kilometers). According to the United States Census Bureau, as of the most recent data available in 2020, the estimated population of Madison County, Montana is approximately 8,218 with 6,202 housing units.

Silver Bow County, Montana is approximately 718 square miles (1,859 square kilometers). According to the United States Census Bureau, as of the most recent data available in 2020, the estimated population of Silver Bow County, Montana is approximately 36,407 with 17,530 housing units.

$8.872 Billion in real estate was sold in 2021 by 1,201 real estate agents in the market served by BSCMLS. $6.448 Billion worth of residential real estate was sold in 2021. $668,346 was the average residential real estate transaction in 2021.

2021 Residential Sales by City

City Sales Volume 2021
Bozeman $2,537,282,941
Big Sky $1,212,317,216
Belgrage $640,768,972
Livingston $343,285,136
Butte $301,018,515

Investment Real Estate

Investment real estate refers to the purchase of real property with the intention of generating income and capital appreciation. Real estate has been a popular form of investment for centuries, offering diversification and a hedge against inflation. In this article, we will discuss the different types of investment real estate and explain why it is a popular choice for investors.

Types of Investment Real Estate

  • Residential Real Estate: This type of investment real estate involves purchasing single-family homes, condominiums, or apartments that can be rented out to tenants. Residential real estate is a popular choice for investors who are looking for a steady income stream.
  • Commercial Real Estate: Commercial real estate includes office buildings, retail centers, industrial parks, and other income-producing properties that are used for business purposes. This type of investment real estate is more complex than residential real estate and requires more expertise, but can offer higher returns.
  • Raw Land: Raw land refers to undeveloped land that can be used for agricultural or residential purposes. This type of investment real estate is often viewed as a long-term investment and is a good option for investors who are looking to diversify their portfolio.
  • REITs (Real Estate Investment Trusts): REITs are companies that own, manage, and finance income-producing real estate. They allow investors to invest in a diversified portfolio of real estate assets without having to directly own the properties. REITs are a popular choice for investors who want to invest in real estate without the hassle of managing properties.

Why Investment Real Estate is Popular

Diversification: Real estate is an asset class that is uncorrelated with traditional stock and bond investments, making it a good option for diversifying a portfolio. By including real estate in a portfolio, investors can reduce the overall risk of their investments and potentially improve their returns.
Inflation Hedge: Real estate is a good hedge against inflation because it typically appreciates in value over time. As the cost of goods and services increases, the value of real estate also increases, offering investors protection against the eroding power of inflation.
Income Generation: Investment real estate can provide a steady income stream in the form of rental income. This can be especially attractive for investors who are looking for a passive source of income.
Capital Appreciation: Real estate has the potential to appreciate in value over time, offering investors the potential for capital gains when they sell the property.

Investment Real Estate Classifications

Investment Real Estate Classifications are used to describe the quality and condition of investment real estate properties. Here’s a brief description of each classification:

  • Class A: Class A properties are considered the highest quality properties in terms of their location, age, appearance, and finishes. They are typically well-maintained and have a strong reputation in the local market. Class A properties are usually newer and have modern amenities and are often occupied by high-credit tenants.
  • Class B: Class B properties are considered to be of a lower quality than Class A properties but still offer good value for investment. They may be older, have outdated finishes and amenities, and be located in less desirable areas. Class B properties are often occupied by medium-credit tenants and may require some renovations or upgrades to improve their value.
  • Class C: Class C properties are considered the lowest quality properties in terms of their condition and location. They are often older, poorly maintained, and located in less desirable areas. Class C properties may require significant renovations and upgrades to improve their value and attract tenants.
  • Class D: Class D properties are the lowest-quality properties and typically have a high vacancy rate, low rental income, and are located in economically distressed areas. These properties may require extensive renovations and upgrades and are often considered to be at a high risk for investment.

It’s important to note that these classifications can vary by region and market and may not always be clearly defined. However, they are commonly used as a guide to help investors make informed investment decisions in commercial real estate.

In conclusion, investment real estate is a popular choice for investors due to its potential for diversification, income generation, capital appreciation, and as a hedge against inflation. Whether you’re looking for a long-term investment or a steady source of passive income, investment real estate can be a valuable addition to your portfolio.

Green Homes - Bozeman, Montana

Green Homes

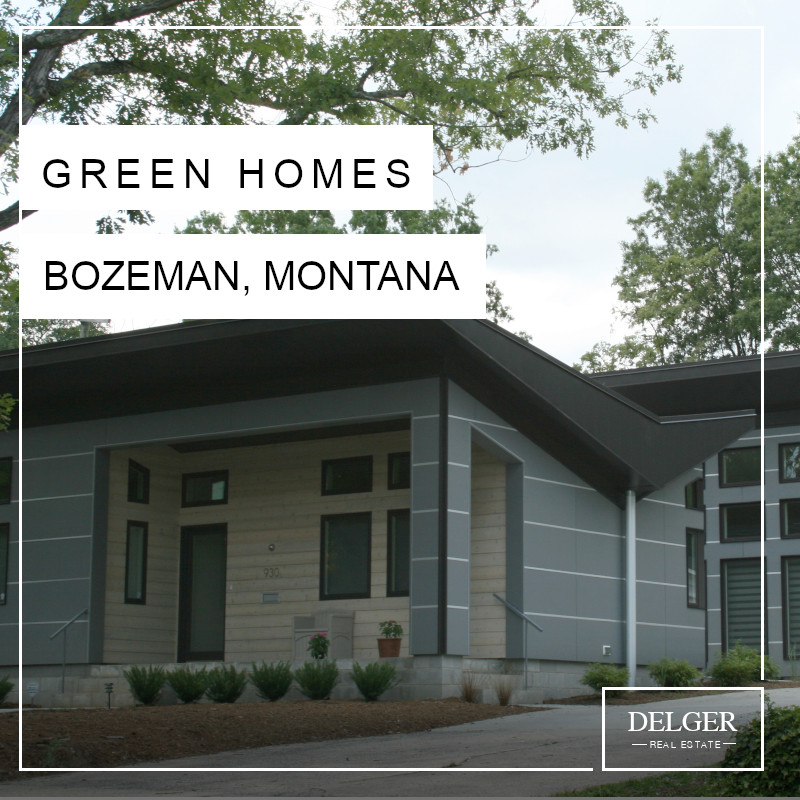
Green Homes - Bozeman, MontanaA green home is a residence that has been designed, built, and operated in a way that minimizes its impact on the environment and maximizes its energy efficiency. Green homes may incorporate a variety of features to reduce their energy consumption and environmental impact, including:

  • Energy efficiency: Green homes are designed to be more energy efficient, which means they use less energy to heat and cool the home. This can help reduce energy costs and lower your carbon footprint.
  • Improved indoor air quality: Green homes often feature materials and designs that improve indoor air quality, such as low- or no-VOC paints and finishes, and energy-efficient air filtration systems.
  • Increased durability: Green homes are often built with durable, low-maintenance materials that are less likely to wear out or need repairs, which can save you money over time.
  • Increased resale value: Green homes are becoming more popular and in demand, and they may be worth more when it comes time to sell your home.
  • Lower environmental impact: Green homes are designed to have a smaller environmental impact, which means they use fewer resources and generate less waste. This can help protect the environment and preserve natural resources.

Green homes may also be designed to have a smaller footprint, with a focus on compact and efficient use of space. By reducing their energy and resource consumption, green homes can save homeowners money on utility bills and contribute to a more sustainable future.

Minimising a home’s impact on the environment and maximising its energy efficiency doesn’t require it to be a green home. For both real estate investors and individual home owners Real Estate Impact Management and “Smart Home Management” can mean substantial cost savings and reduce the impact your property has on the environment.

Overall, green homes offer a number of benefits for homeowners in Bozeman, Montana, including lower energy costs, improved indoor air quality, and a smaller environmental impact.

Delger Real Estate advises clients on ways to reduce the environmental impact of homes. Contact Delger Real Estate to learn more about Real Estate Impact Management.

Real Estate Asset Management

Real Estate Asset Management

Real Estate Asset ManagementDelger Real Estate works with owners & investors to increase the value of their properties and improve their return on investment. We help maintain properties, and reduce the burden of real estate ownership. Whether a single personal residence, or a portfolio of investment properties Delger Real Estate has the specialized skills and experience to ensure success.

Real estate asset management is the process of managing and maximizing the value of a real estate asset. Delger Real Estate assists clients in identifying, acquiring, and maintaining properties that generate income or appreciate in value over time.

Real Estate Asset Management Services We Offer

  • Conducting Market Research
  • Identifying & Acquiring Real Estate
  • Budgeting, Forecasting, & Reporting
  • Overseeing Property Maintenance And Repair
  • Home Monitoring(Air Quality Testing, Temperature Monitoring, Leak Detectors, etc.)
  • Impact Management(Reducing Utility Usage)
  • Developing & Implementing Strategies To Increase Property Value(Maintenance/Remodel)
  • Reducing The Burden Of Real Estate Ownership

A property can cost quite a bit of money to maintain when you consider operational costs, maintenance, closing costs, and taxes. Delger Real Estate advises clients on ways to reduce the ownership and maintenance costs of properties. We advise clients on preventative maintenance and repairs, and manage contractors for work performed.

Delger Real Estate also helps clients with Real Estate Impact Management. Buildings are responsible for more than 40% of global energy used, and as much as one-third of global greenhouse gas emissions per the International Standard Organization. Minimising a home’s impact on the environment and maximising its energy efficiency doesn’t require it to be a “green home“. For both real estate investors and individual home owners Real Estate Impact Management and “Smart Home Management” can mean substantial cost savings and reduce the impact your property has on the environment.

Delger Real Estate assists clients with implementing home monitoring sensors for temperature drops, water leaks, and more. Furnace outages and water leaks can cause serious damage to your home, especially if undetected. Placing water leak detectors near repeat offenders like sump pumps, water heaters, washers or sinks can help you mitigate water damage by sending alerts. Temperature monitors send alerts when the internal temperature of property drops below a safe level. Automatically monitoring temperature drops and water leaks provides peace of mind to owners, and prevents expensive maintenance repairs.

Please Contact Delger Real Estate to learn more about Real Estate Asset Management.

Real Estate Impact Management

Real Estate Impact ManagementBuildings are responsible for more than 40% of global energy used, and as much as one-third of global greenhouse gas emissions per the International Standard Organization. For both real estate investors and individual home owners Real Estate Impact Management and “Smart Home Management” can mean substantial cost savings and reduce the impact your property has on the environment.

Reducing Water Usage

Real Estate Impact Management and Smart Home Management for reducing water usage can be as simple as ensuring that sinks and toilets are not leaking. The average North American household wastes about 10,000 gallons of water from household leaks every year. About one in ten homes have severe leaks that waste 90 gallons or more per day. Approximately 27% of a typical home’s water usage comes from toilet flushing. A leaky toilet can have a major impact on water bills. A leaking toilet can lead to thousands of gallons of water used every month. A constantly running toilet may waste about eight gallons per hour, or 200 gallons per day. Left unnoticed, a running toilet could waste over 6,000 gallons per month. The toilet is one of the most common water wasters but its leaks tend to be less noticeable than faucet leaks. We can help you identify if toilets and sinks are leaking.

Frequent Causes of High Water Usage

Leaks and drips aren’t the only contributing factors to high water bills. Other wasteful practices that drive up costs include:

  • Running the dishwasher partly full (wastes 320 gallons per year)
  • Leaving the tap open when you brush your teeth (wastes 8 gallons per day)
  • Letting the water run for five minutes while washing dishes by hand (wastes 10 gallons every time)
  • Failing to fix a broken sprinkler head (wastes 2,400 gallons per month)

Frequent Causes of Damage From Water Leaks

Relatively innocent leaks drip water from the source into the drain or sewer line. This wastes water and costs you money, but it doesn’t cause any damage. However, leaks from pipes, fittings, and hoses can damage your home and lead to high repair costs. Besides your sinks and toilets, here are the other places to watch out for leaks:

  • Washing machine hoses
  • Refrigerator
  • Dishwasher
  • Plumbing under kitchen and bathroom sinks
  • Pipes
  • Roof
  • Windows and doors

Whether you’re worried about high bills or water damage, it’s worthwhile to find and stop leaks quickly. We can help you identify and fix water leaks.

Reducing Electricity Usage

Real Estate Impact Management and Smart Home Management for reducing electricity usage can be as simple as replacing old incandescent light bulbs with modern LED lighting. LED lighting has lower energy usage which reduces electricity costs. LED lighting lasts longer which reduces maintenance costs. LED lighting generates less heat, which reduces costs associated with cooling homes on warm summer days. We encourage our clients to turn off power sources when they aren’t being used in order to cut back on costs and save energy.

Reducing Heating and Cooling Costs

According to the U.S. Department of Energy, 49% of a home’s energy bill is spent on heating and cooling. One of the main reasons your energy bills might spike during the winter months is because your home isn’t properly insulated. According to the North American Insulation Manufacturers Association (NAIMA), 90% of single-family homes in the U.S. are under-insulated, so chances are high that your house could use some work. Homes built prior to 1960 are particularly vulnerable.

Heating, ventilation, and air conditioning (HVAC) is the use of various technologies to control the temperature, humidity, and purity of the air in an enclosed space. The goal is to provide thermal comfort and acceptable indoor air quality. Real Estate Impact Management and Smart Home Management for reducing HVAC costs starts with proper HVAC maintenance. Good HVAC maintenance results in less energy consumed and increases the useful life of the equipment. We suggest that filters and systems be checked at regular maintenance intervals. A well-maintained system will cost home owners less over time and lower energy costs.

Your heating and cooling systems might be operating at peak efficiency, but if your home is not adequately insulated, you may be wasting money on your monthly electricity bill and gas bills. A home’s insulation helps with heating and cooling all year round. If your insulation is lacking, your heating and cooling equipment have to operate longer to achieve your desired indoor temperature, which means added utility costs, shortened equipment life, and higher impact on the environment. The EPA estimates that the average homeowner can save 15% on heating and cooling costs (11% of total energy costs) by adding insulation in attics, crawl spaces, and basement rim joists.

Conducting an energy audit of your home will give you the best idea of where to focus your insulation upgrades. Though for most homes—again, especially those built before 1960—it’s safe to say that the attic is the place to start.

Reducing Air Leaks

Real Estate Impact Management and Smart Home Management for reducing air leaks begins by making a list of obvious air leaks (drafts). The potential energy savings from reducing drafts in a home may range from 10% to 20% per year, and the home is generally much more comfortable afterward.

Check for indoor air leaks, such as gaps along the baseboard or edge of the flooring and at junctures of the walls and ceiling. Also check for leaks on the outside of your home, especially in areas where two different building materials meet. Other places to check for leaks include windows, doors, lighting and plumbing fixtures, switches, and electrical outlets. Also check for open fireplace dampers. See detecting air leaks for detailed instructions on finding air leaks yourself.

Please Contact Delger Real Estate if you would like to learn more about Real Estate Impact Management for your property.

How Much Do Homes Cost in Bozeman?

Delger Real Estate is able to provide the earliest and most reliable information on the Bozeman housing market by using our direct access to data from the local multiple listing services. When reporting on how much homes cost in Bozeman, our preferred method is to use the Median Price of homes.

Median price is generally a better indicator than the average price when dealing with property prices, especially in a market like Bozeman which can have extreme prices at the high end of the market and dramatically increase the average price of homes sold. The median price divides all transactions into two equal parts: 50% of transactions occur at a price that is lower than the median price and the other 50% occur at a price that is higher. The advantage of the median value as a measure of central tendency is that it is not adversely influenced by extreme prices. Conversely, the disadvantage of average prices (and all averages) is that they can be influenced by extreme prices, which can lead to major distortions that bias data interpretation.

Median Cost of Residential Single Family Homes in Bozeman City Limits

The median price for single family homes sold in Bozeman City Limits for 2022 is $799,000. The median price for single family homes in Bozeman city limits have gone up 14.14% over the past year.

YEAR
BOZEMAN CITY LIMITS
YoY CHANGE
2022
$799,000
+ 14.14%
2021
$700,000
+ 29.63%
2020
$540,000
+ 17.39%
2019
$460,000
+ 7.6%
2018
$427,500
+ 12.06%
2017
$381,500
+ 6.19%
2016
$359,250
+ 6.76%
2015
$336,500


Median Cost of Residential Single Family Homes in the Greater Bozeman Area

Prices for homes in the greater Bozeman area are typically higher than homes prices in Bozeman city limits. Homes outside of city limits typically have more square feet, and are on larger lot sizes. The median price for single family homes sold in the Greater Bozeman Area(not including Bozeman City Limits) for 2022 is $1,015,000. The median price for single family homes in the Greater Bozeman Area have gone up 20.83% over the past year.

YEAR
BOZEMAN CITY LIMITS
YoY CHANGE
2022
$1,015,000
+ 20.83%
2021
$840,000
+ 22.63%
2020
$685,000
+ 23.65%
2019
$554,000
+ 7.57%
2018
$515,000
+ 12.67%
2017
$457,100
+ 14.27%
2016
$400,000
– 0.62
2015
$402,500
Read more...